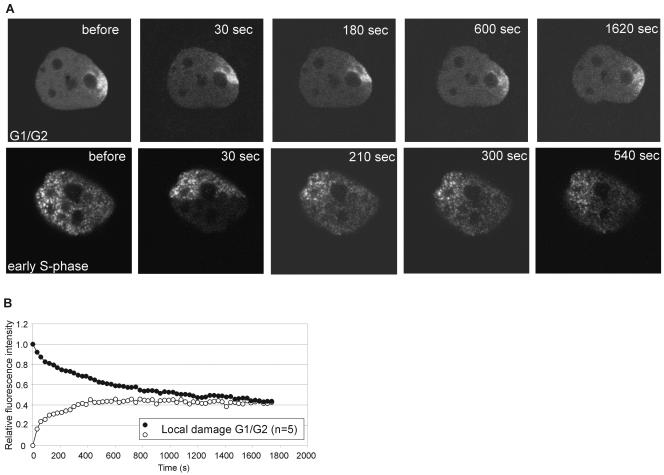
FIG. 4.
Fluorescence redistribution after photobleaching analyses of GFP-hPCNA in locally UV-irradiated cells. (A) Example of FLIP/FRAP analysis in locally irradiated cells. The upper panel represents a cell in the G1 or G2 phase of the cell cycle and shows local accumulation of GFP-hPCNA in the damaged area. The lower part of the cell, including half of the site of local damage, was photobleached, and the cell was imaged every 30 s. A similar experiment (lower panel) was done on a cell that was, based on the PCNA staining pattern, in the early S phase of the cell cycle. (B) Quantitation of the simultaneous FRAP and FLIP experiments on GFP-hPCNA after local UV damage on G1/G2-phase cells. “n” represents the number of cells examined.

