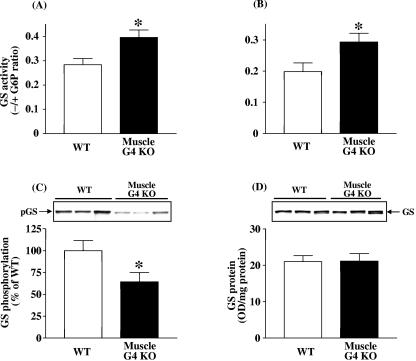
FIG. 2.
Basal glycogen synthase activity in tibialis anterior (A) and gastrocnemius (B) muscle, and glycogen synthase phosphorylation level (C) and protein amount (D) in gastrocnemius muscle from WT and muscle-G4KO mice. Mice were fasted overnight. (A and B) The ratio of glycogen synthase activity represents the activity measured in the absence divided by that in the presence of glucose-6-phosphate. (C) Proteins in muscle lysates (5 μg) were separated by SDS-PAGE on 8% gels and transferred to nitrocellulose membranes. (D) Proteins in muscle lysates (50 μg) were separated by SDS-PAGE on 8% gels and transferred to nitrocellulose membranes. Glycogen synthase (GS) was visualized by immunoblotting with a glycogen synthase antibody or a phospho-specific glycogen synthase antibody. Results are means ± SEM for five to eight mice per group. OD, optical density. *, P < 0.05 versus WT.

