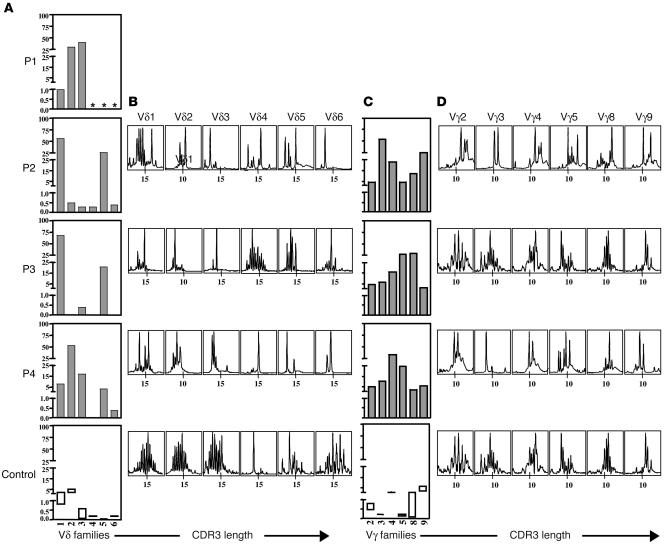
Figure 2.
TCRVγ and -Vδ usage by patients’ T lymphocytes. Vδ (A) and Vγ (C) repertoire was determined either using available specific mAb in immunofluorescence assay in P1 or using real-time PCR analysis in P2, P3, and P4. The x axis indicates Vδ family usage by TCRγδ cells; the y axis indicates relative frequency (%) within the TCRγδ T cells. Controls values shown in rectangles represent mean ± 2 SDs. Similar results were obtained using available specific mAb in immunofluorescence assay (data not shown). *Not done. Profiles of the fluorescent Vδ-Cδ (B) and Vγ-Cγ (D) runoff products obtained with mononuclear cells. The x axis indicates CDR3 length.

