Figure 7.
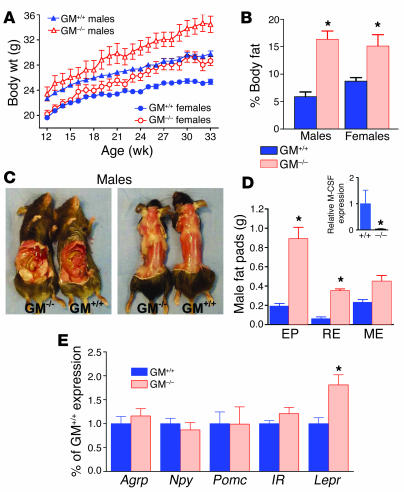
Body fat is increased in GM–/– mice. GM–/– and control GM+/+ male and female mice were monitored from 12 to 33 weeks of age. GM–/– mice gained significantly more body weight than did age- and sex-matched GM+/+ mice (A), and GM–/– mice had increased body fat as a percentage of total body weight (B). n = 7–11; mean ± SEM. (C) Visceral and s.c. fat were visibly increased in male GM–/– mice, compared with GM+/+ control mice. (D) Weights of epididymal (EP), retroperitoneal (RE), and mesenteric (ME) fat were increased in male GM–/– mice compared with GM+/+ control mice. *P < 0.05; n = 5; mean ± SEM. Inset: M-CSF expression was decreased in GM–/– mice. M-CSF mRNA was measured by Q-PCR in mesenteric fat from GM–/– and GM+/+ male mice. M-CSF expression was reduced in GM–/– mice, compared with GM+/+ mice. (E) NPY, AgRP, POMC, and insulin receptor (IR) mRNA expression were similar in both groups, but LepR expression was increased in GM–/– hypothalamus. n = 10–11; mean ± SEM. *P < 0.05.

