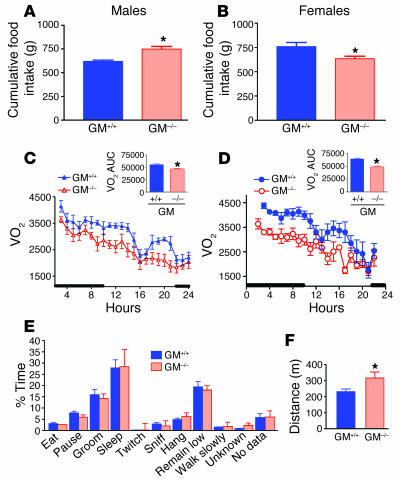
Figure 8.
Food intake, energy expenditure, and activity. Average daily food intake was slightly increased in GM–/– male mice (A) but was slightly lower in female GM–/– mice (B), compared with GM+/+ mice. VO2, measured by indirect calorimetry, was decreased in male (C) and female (D) GM–/– mice compared with GM+/+ mice. Area under the curve (AUC) was significantly decreased for both male (C, inset) and female (D, inset) GM–/– mice. Activity of male GM–/– and GM+/+ mice was monitored for a 24-hour period using video equipment. (F) Time spent performing various activities did not differ between male GM–/– and GM+/+ mice; however, the total distance traveled over the 24-hour period was greater for GM–/– mice than for GM+/+ controls. *P < 0.05; n = 7–11; mean ± SEM.

