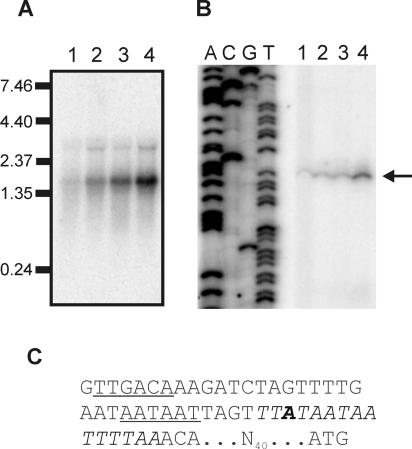
FIG. 4.
Transcriptional analysis of katA of B. cereus. (A) Northern blot analysis of the transcription of katA. Total RNA was extracted from B. cereus ATCC 14579 and B. cereus FM1400 cells during mid-exponential growth in BHI (lane 1 and 3, respectively) and after a 10-min exposure to 42°C (lane 2 and 4, respectively). A 32P-labeled internal PCR product of katA was used as a probe. Hybridization of the probe with target RNA was visualized by exposure to a Phosphoscreen and scanning with a Storm scanner. Marker sizes (in kb) are indicated. (B) Primer extension analysis of the promoters 5′ of katA. Total RNA was extracted from B. cereus ATCC 14579 and B. cereus FM1400 cells during mid-exponential growth in BHI (lane 1 and 3, respectively) and after a 10-min exposure to 42°C (lane 2 and 4, respectively). The mapped transcriptional start site is indicated with an arrow. The lanes labeled A, C, G, and T are the corresponding sequencing ladder for the localization of the transcripts. (C) Sequence of the promoter 5′ of katA. Identified −35 and −10 regions are underlined. Bold type indicates the mapped transcriptional start site. The putative PerR-binding site is indicated in italics. The spacing to the ATG start codon of katA is also indicated.

