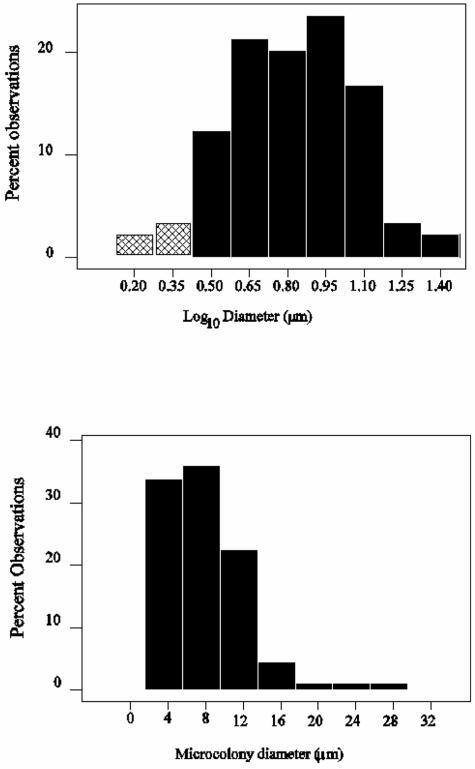
FIG. 4.
Probability distributions of microcolony diameter for raw measurements (lower panel) and log-transformed measurements (upper panel) for 89 microcolonies from a full-scale wastewater treatment plant (Wanlip), using Nso1225. The putative unobserved fractions are shown as the shaded area in the log-transformed data and were calculated to be less than ca. 3.5% of the total possible observations.

