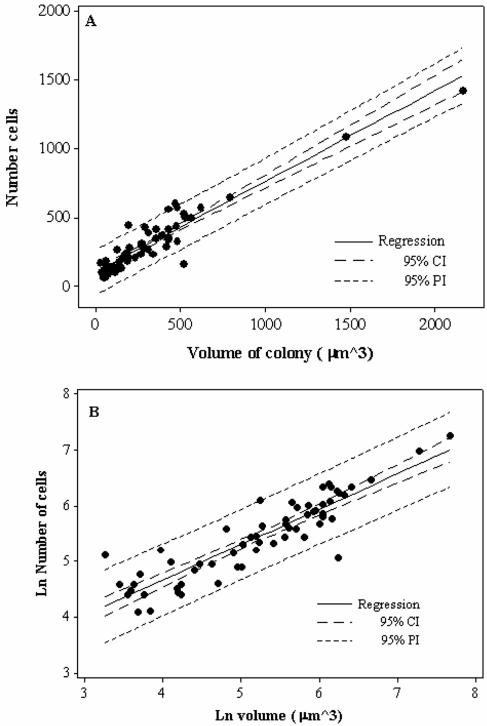
FIG. 5.
Relationship between microcolony size and AOB cell numbers in activated sludge for the raw (A) and natural-log-transformed (B) data. For the raw data, the r2 value was 0.89 and both the slope (0.66) and the intercept (101) were statistically significant (P < 0.001). However, both sets of raw data were log-normally distributed, and a Box-Cox analysis showed that a natural log transformation was appropriate. For the natural-log-transformed data, the r2 value was 0.81 and both the slope (0.64) and the intercept (2.1) were statistically significant (P < 0.001). We recommend the use of the log-transformed data. CI, confidence interval; PI, prediction interval.

