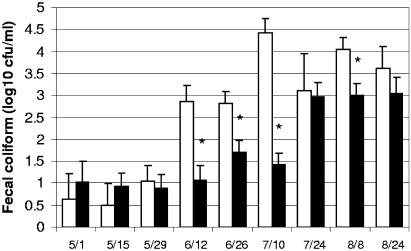
FIG. 2.
Log10 concentrations of coliform bacteria in water troughs filled with chlorinated (▪) and nonchlorinated (□) water. Error bars depict the standard error of the mean log10 CFU/milliliter. Asterisks indicate sampling dates on which the chlorinated and nonchlorinated troughs differed significantly (P < 0.01) in log10 coliform bacterial concentrations.

