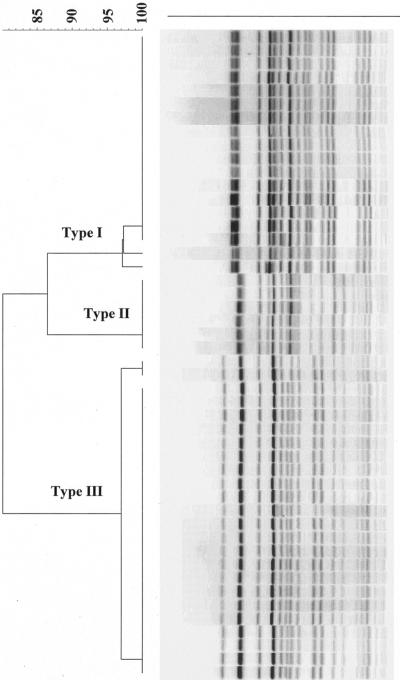
FIG. 1.
Dendrogram generated to show the relationship of 48 isolates (24 from RAMSs and 24 from fecal cultures) of E. coli O157 from 24 cattle. The bands were analyzed by Dice similarity coefficient and the unweighted pair group method for clustering, with a position tolerance setting of 1.5% for optimization and a position tolerance of 1.5% for band comparison. The scale at the top of the dendrogram indicates the levels of similarity between isolates.

