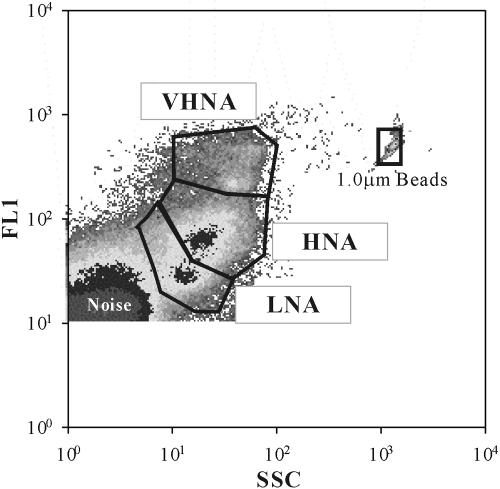
FIG. 1.
Example of a flow cytogram of bacterioplankton in Lake Biwa (the sample was collected on 15 October 2001 at a depth of 40 m at station 5). Side scatter (SSC) and fluorescence (FL1) emitted from SYBR Green I bound to bacterial nucleic acid differentiated noise and bacteria enclosed by the gray gate. Bacteria were further divided into three subgroups, the VHNA, HNA, and LNA bacteria, according to the positions in the cytogram. Beads were added as internal standards.

