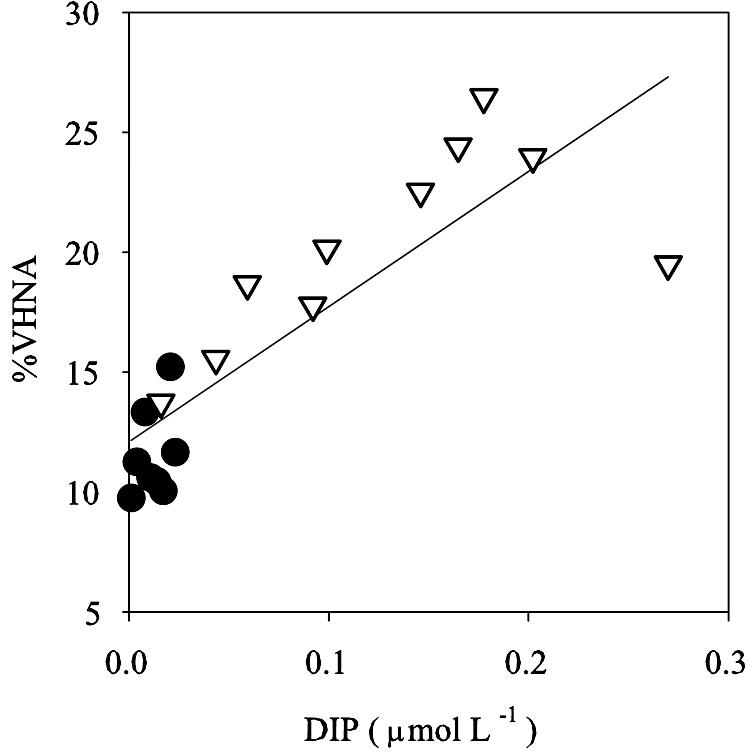
FIG. 5.

Relationship between depth-integrated averages of %VHNA and DIP concentration in the upper layer (circles) and lower layer (triangles). All the data were used to draw the regression line: %VHNA = 12.1 + 56.4 × DIP (r2 = 0.71; P < 0.01; n = 18).
