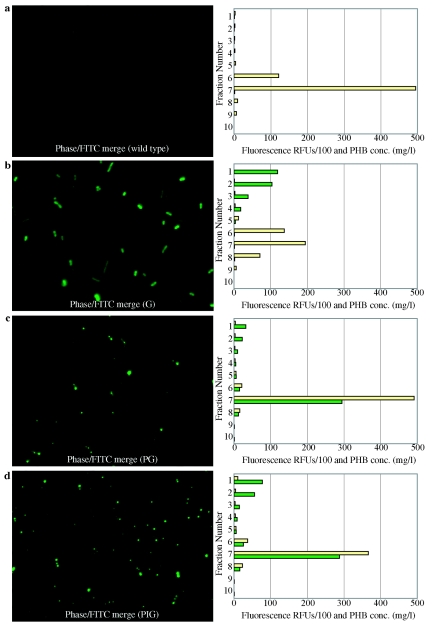
FIG. 1.
Representative GFP localization. Fluorescence microscopy and sucrose density gradient fractionation of cell lysates. a) Wild-type R.eutropha. b) R. eutropha G (expressing GFP). c) R. eutropha PG (expressing PhaP-GFP). d) R. eutropha PIG (expressing PhaP-intein-GFP). Cell lysates were generated by sonication and added to the top of a sucrose density gradient. Fluorescence of individual sucrose density gradient fractions is expressed in relative fluorescence units divided by 100 and shown in green. Corresponding PHB concentrations are expressed in mg/liter and shown in tan.

