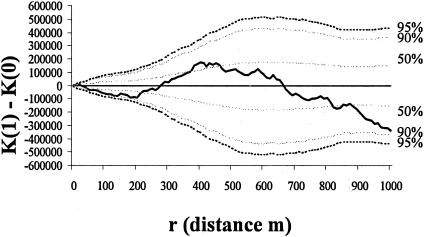
FIG. 4.
K-function analysis of the difference in the distributions of infected rabbits [K(1)] and noninfected rabbits [K(0)] across the site (dotted lines, confidence envelopes; solid line, CSR; boldface line, difference between K-functions of infected and noninfected rabbits). Above CSR indicates that the M. avium subsp. paratuberculosis-infected rabbits are clustered; below indicates that they are regularly distributed within the distribution of all rabbits.

