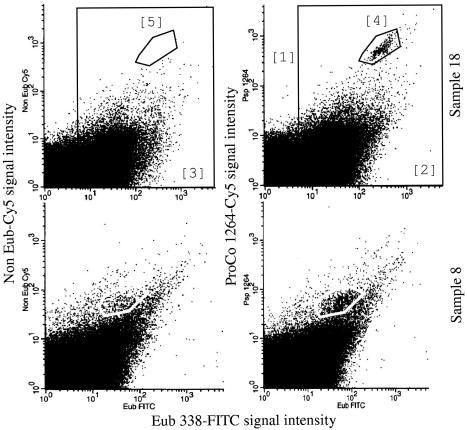
FIG. 3.
FISH-FC dot plots for MPN samples 8 and 18 hybridized with ProCo-1264. Fluorescence intensities are displayed as logarithmic values. Regions: 1, autofluorescence events; 2 and 3, gated regions that include total bacterial events; 4, ProCo-1264-specific events; 5, specific control region. Bacterial percentages for P. productus and C. coccoides were calculated as follows: 100 × [(counts in region 4/counts in region 2) − (counts in region 5/counts in region 3)].

