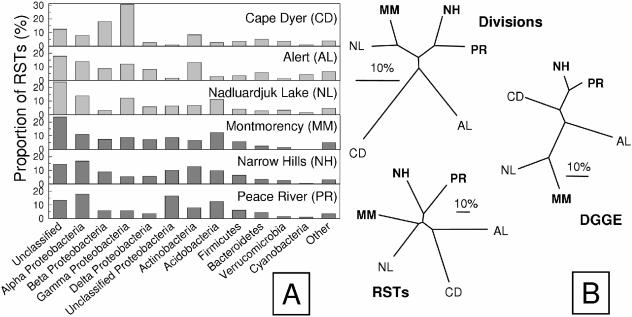
FIG. 3.
Comparison of RST library composition. (A) Relative abundance of phylogenetic divisions for each soil library in which RST sequences were assigned to the same taxonomic group as the closest relative in the RDP-II database. Dark bars indicate boreal forest samples. (B) UPGMA dendrograms showing Bray-Curtis similarity indices for phylogenetic divisions (Divisions), RST distributions (RSTs), and Pearson correlations of DGGE fingerprint patterns (DGGE). The scale bar indicates 10% dissimilarity between samples. Boldface sample codes indicate boreal forest soil samples.

