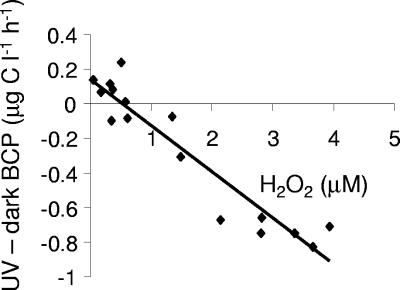
FIG. 2.
Change in bacterial carbon production (i.e., percentage of increment in BCP from the addition of irradiated HS relative to nonirradiated control) 5 h after the humic samples were added to unfiltered lake water plotted as a function of the concentration of the hydrogen peroxide produced during humic substance irradiation (y = −0.27x + 0.14, r2 = 0.90).

