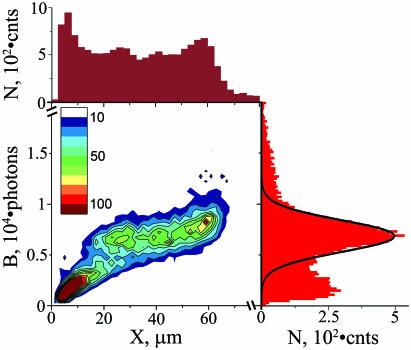
Figure 1.
Characterization of DNA stretching. A two-dimensional histogram of burst size (B is the total number of photons per molecule) and length (X is the DNA extension in the direction of flow) for individual DNA molecules is shown as a heat map: 500 photons by 2 µm binning, respectively, and histogram occupancy as indicated in the inset legend. The adjacent histograms show distributions of DNA lengths (maroon at the top) and burst sizes (red at the right) with an interpolated Gaussian curve (black line) corresponding to full size BAC DNA. N is number of events. Data include 15 283 molecules.

