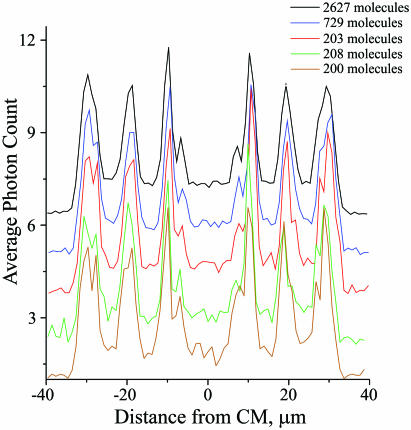
Figure 3.
Unoriented maps obtained with different numbers of molecules. Upper black map includes 2627 DNA molecules with sizes of 62–66 µm. Blue map includes a subset of 729 DNA molecules within narrower size interval of 63.5–64.5 µm. Three lower maps red, green and brown are obtained with different subsets of the narrow size selection (63.5–64.5 µm), which include 203, 208 and 200 DNA molecules, respectively. Maps were obtained with 1 µm step and displaced along the ordinate to simplify comparison. See Figure 2 legend for other details.

