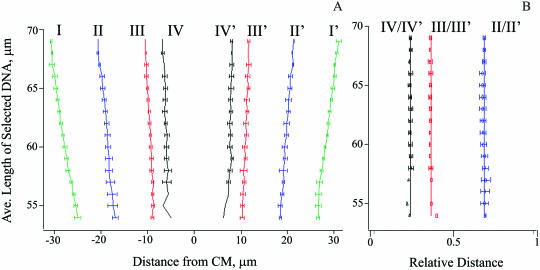
Figure 4.
Analysis of DNA conformation under different degrees of stretching. (A) Measured positions of major peaks in unoriented maps. Roman numbers defined in Figure 2D. (B) Relative distances between peaks calculated as the ratio of distances between symmetric peaks and the outermost peaks LI–I′. Symbols II/II′, III/III′ and IV/IV′ denote the relative distances LII–II′/LI–I′, LIII–III′/LI–I′ and LIV–IV′/LI-I′, respectively. Traces of DNA molecules at 5 µm intervals were averaged, with the ordinate centered on the selection interval. Lines in panel A are drawn by eye; straight vertical lines in panel B are drawn at the positions corresponding to the averages of II/II′, III/III′ and IV/IV′ datasets at 0.68, 0.36 and 0.24, respectively.

