
Figure 4.
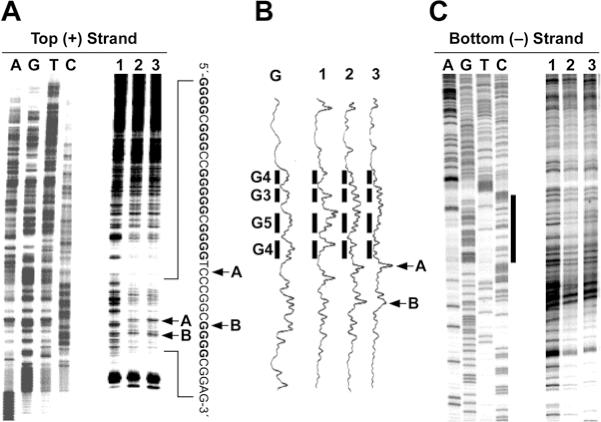
In vitro footprinting of the VEGF promoter region with DNase I. (A) Autoradiograms showing DNase I cleavage sites on the top strand of a supercoiled pGL3-VEGF plasmid. The plasmid DNA was incubated in the absence of salt (lane 1), or in the presence of 100 mM KCl without (lane 2) and with (lane 3) 1 µM telomestatin at 37°C for 1 h before digesting with DNase I. DNase I cleavage sites were mapped using linear amplification by PCR with 32P-labeled gene-specific plasmid DNA pretreated with DNase I. Arrows A and B indicate the hypersensitive cleavage sites to nucleases. (B) Densitometric scanning of the autoradiogram in (A). The bars indicate the guanine repeats involved in the formation of the G-quadruplex structures. Arrows A and B indicate the hypersensitive cleavage sites to nucleases. (C) Autoradiograms showing DNase I cleavage sites on the bottom strand of a supercoiled pGL3-VEGF plasmid. The designation of lanes 1–3 was as in (A) above. DNase I cleavage sites were mapped using linear amplification by PCR with 32P-labeled gene-specific plasmid DNA pretreated with DNase I. The vertical bar next to the gel indicates the polypyrimidine tract.