
Table 2.
Analysis of T cell recognition of CII-peptide 259–273 in RA patients
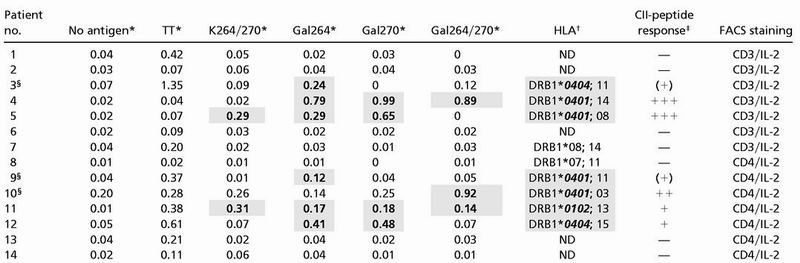 |
Percentage of IL-2-producing T cells after in vitro culture of PBMC without antigen (No antigen) or following stimulation with tetanus toxoid (TT1), or following stimulation with CII-peptides (see Fig. 1). IL-2 production was analyzed for the entire CD3+ T cell population in patients 1 to 7 or within the CD4+ subset in patients 8 to 14.
Percentage of double-positive T cells.
DRB1-alleles containing the “shared epitope” QKRAA or QRRAA in amino acid positions 70–74 are highlighted in shaded cells and bold italics; subtyping of DRB1* was performed only on 04 and 01 haplotypes. ND, Not determined.
Semiquantitative scoring of T cell response to any of the CII-peptides (% of IL-2-producing T cells): —, <0.1% or <3× (no antigen control); (+), ≥3× (no antigen control); +, ≥4× (no antigen control); ++, ≥5× (no antigen control); +++, ≥10× (no antigen control). Shaded cells and bold figures in the table highlight CII-peptide-specific responses fulfilling at least the (+) criterion.
Patients where repetitive analyses were performed. Patient 3 elicited a similar response exclusively to the Gal264-peptide in a second analysis performed 1 wk later (see Fig. 4). For patient 9, in a second study performed 1 mo later, 0.1% of CD3+ cells produced IL-2 upon stimulation with the Gal264-peptide, compared with 0.04% in the absence of antigen and 0.02% after stimulation with the K264/270- or Gal270-peptide. Patient 10 failed to respond to any CII-peptide when investigated 6 mo later.