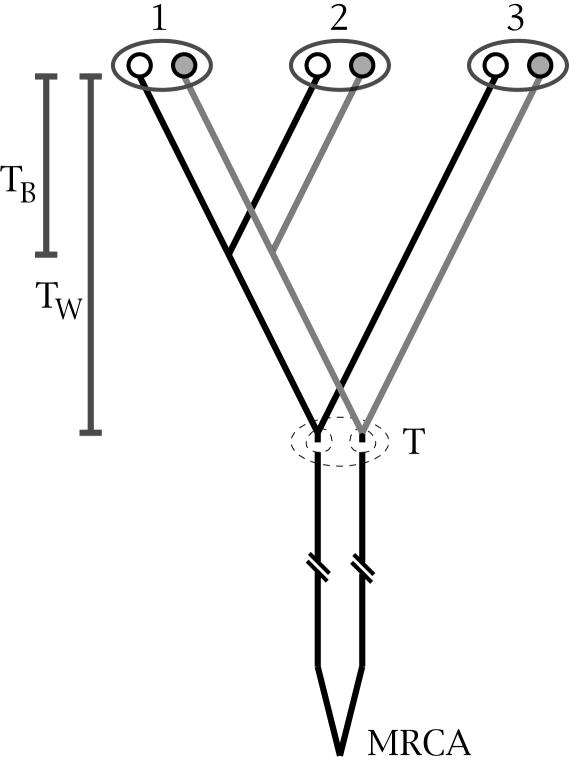
Fig. 3.
A gene tree of an obligate asexual population depicting six gene copies from three diploid individuals. Each ellipse represents an individual, and the two circles within each ellipse are homologous gene regions. TB, divergence time between individuals 1 and 2; TW, divergence time within individual 3; T, point in time when obligate asexual reproduction began; MRCA, most recent common ancestor of all gene copies sampled.

