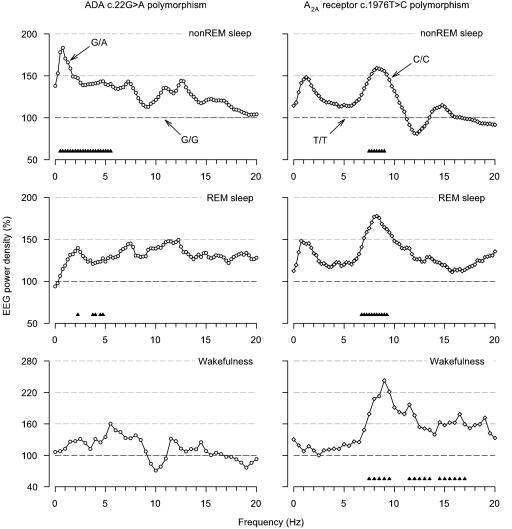
Fig. 3.
The ADA 22G→ A and A2A receptor 1976T→ C polymorphisms modulate the EEG in sleep and wakefulness in healthy individuals. Relative EEG power density spectra (C3A2 derivation) in non-REM sleep (stages 2–4), REM sleep, and wakefulness (average of two 5-min waking EEG recordings with eyes open before and after the sleep episode). (Left) For each frequency bin, power in subjects with the G/A genotype (n = 7, open circles) is expressed as a percentage of the corresponding value in individually matched subjects with the G/G genotype. (Right) For each frequency bin, power in subjects with the C/C genotype (n = 9, open diamonds) is expressed as a percentage of the corresponding value in individually matched subjects with the T/T genotype. Geometric mean values are plotted at the lower limit of the bins (0.25-Hz resolution in non-REM and REM sleep, 0.5-Hz resolution in wakefulness). Triangles at the bottom of the panels indicate frequency bins, which differed significantly from G/G and T/T genotypes, respectively (P < 0.05, two-tailed paired t tests).

