Fig. 4.
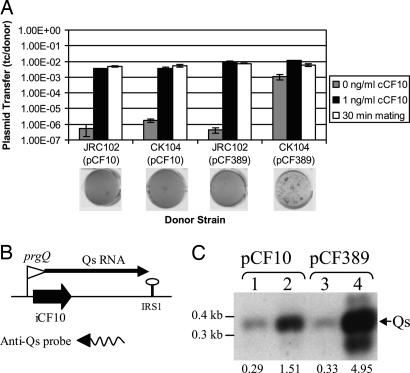
Regulation of plasmid transfer and Qs (encoding iCF10) expression by PrgY and by endogenous pheromone. (A) Transfer of pCF10 and pCF389 (prgY-null) out of CK104 and JRC102 donor strains. OG1Sp was used as a recipient strain. Pheromone induction (0 and 1 ng/ml cCF10 samples) experiments were carried out by a protocol different from that with the longer mating time (30-min sample), with the data displayed side-by-side for comparison. For 0 and 1 ng/ml cCF10, donors and recipients were grown overnight in M9 medium and diluted 1:10, then grown an additional 2 hr in the presence or absence of 1 ng/ml cCF10 and combined for a 10-min mating before plating. For the 30-min samples, donor and recipient strains were grown overnight in THB, diluted 1:10, and grown for 1 hr in the absence of cCF10, then they were combined for 30 min to allow induction of donors by recipient pheromone before plating. Plasmid transfer is depicted as transconjugants per donor. Experiments were done in duplicate; error bars represent one SD about the mean. Clumping assay results for each strain are shown below. Strains induced for plasmid transfer express Asc10 and clump in liquid culture (see text), which causes uneven settling at the bottom of the well (lane 4) of a 96-well plate. Overnight cultures were grown in THB without pheromone and were shaken for 2 hr before a picture was taken. (B) Location of the Qs probe within the regulatory region of pCF10 and pCF389. The digoxigenin-labeled RNA probes were generated by in vitro transcription. The 3′ end of the probes is indicated by an arrowhead. (C) Results of Northern blotting analysis of Qs RNA levels. For Northern analysis, 1 μg of total RNA was separated on a 2% agarose gel, transferred onto nylon membrane, and hybridized with the Qs probe shown in B. The arrow indicates Qs. Strains depicted are as follows: JRC102 (lanes 1 and 3) and CK104 (lanes 2 and 4). These strains harbor the plasmid pCF10 (lanes 1 and 2) or pCF389 (lanes 3 and 4). Relative amounts of Qs as determined by densitometry are displayed below each lane. These data were obtained by determining the profile area with the Bio-Rad molecular analyst (Version 21) software.

