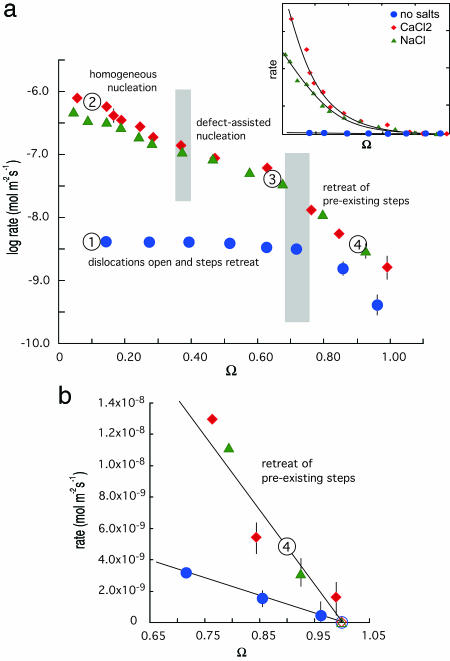
Fig. 1.
Measured rates of quartz dissolution vs. saturation state (Ω) show the dependence on driving force and the presence or absence of simple electrolyte salts. Calculated experimental errors indicate 1SD of the mean estimate and are illustrated for values larger than the symbol diameter. (a) Logarithm of rate vs. saturation state in water (blue circles), 0.0167 M CaCl2 (red diamonds), and 0.05 M NaCl (green triangles). Numbers correspond to conditions that produced the surface structures in Fig. 2, and gray zones show undersaturation range where transitions occur in the dominant dissolution mechanism. Inset uses a linear ordinate to better illustrate the exponential dependence of rate on driving force when salts are introduced. (b) Expanded view of rate dependence on Ω shows the linear dependence on saturation at near-equilibrium conditions. This region is where the widely accepted first-order rate dependence such as Eq. 8 applies. Eq. 8 is fit to the data by forcing rate to zero at Ω = 1.0 as denoted by open symbols.

