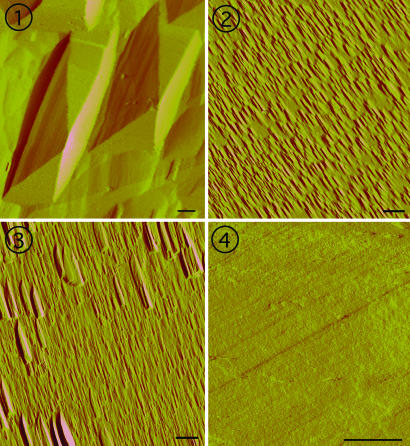
Fig. 2.
AFM images of representative (100) surfaces of quartz exposed to four different solution chemistries for equivalent extents of reaction show the different dissolution processes across driving force and solution chemistry. (Scale bar: 1 μm in all images.)  When Ω = 0.10 in H2O, surfaces are dominated by large etch pits with sloping sides that converge at dislocation sources. Pits are separated by relatively flat regions on the surface.
  For conditions where Ω = 0.10 and the solution contains 0.0167 M CaCl2, the surface is covered with a high density of small pits with flat bottoms and with flanks that are 25% steeper than those measured for pits in
  .
.  At the intermediate driving force of Ω = 0.65 in a salt solution of 0.0167 M CaCl2, a mixture of larger and smaller flat bottom pits form across the surface.
  At a low driving force of Ω = 0.90 in 0.0167 M CaCl2, the surface shows only straight-edged steps with no evidence of pitting.

