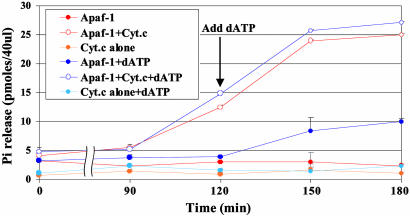
Fig. 3.
Cytochrome c-stimulated dATP hydrolysis by Apaf-1. Apaf-1 (35 pmol) and cytochrome c (175 pmol) were used in a final volume of 40 μl. Aliquots of Apaf-1 alone (filled red circle), Apaf-1 plus cytochrome c (open red circle), and cytochrome c alone (filled pink circle) were incubated at 30°C for 3 h, and dATP hydrolysis was measured at the indicated time points as described in Materials and Methods. For the other three samples, 10 μM of dATP was added to Apaf-1 alone (filled dark blue circle), Apaf-1 plus cytochrome c (open dark blue circle), or cytochrome c alone (filled light blue circle) 2 h after the starting incubation. The dATP hydrolysis was measured by a Malachite Green Phosphate Assay kit as described in Materials and Methods.

