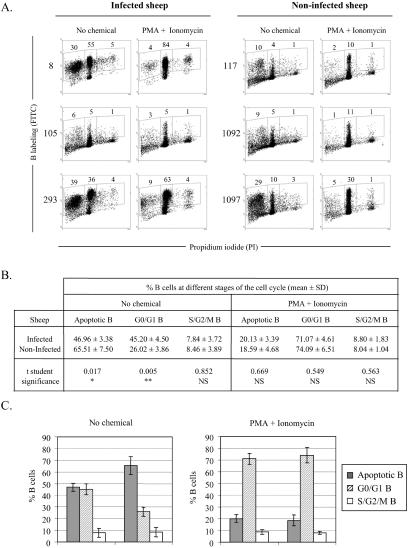
Figure 1.
Apoptosis in short-term cultures of sheep PBMCs. (A) PBMCs were isolated from BLV-infected sheep (nos. 8, 105, and 293) and seronegative controls (nos. 117, 1092, and 1097). Cells were cultivated for 18 h in the absence (no chemical) or in the presence of PMA + Ionomycin and labeled with anti-IgM monoclonal antibody 1H4 and an FITC conjugate. After ethanol fixation, the cells were stained with PI and, after exclusion of the doublets, analyzed by two-color flow cytometry. Results from a representative experiment (10,000 events) are shown as dot plots (x axis, PI; y axis, B lymphocytes). Numbers within the plots represent the percentages of positively stained B cells within each region. (B) Mean percentages (± SD) of B lymphocytes at different stages of the cell cycle (subG1/apoptotic, G0/G1, S+G2/M) were calculated from three independent experiments by using cells isolated from infected animals (nos. 8, 105, and 293) and negative controls (nos. 117, 1092, and 1097). **, P < 0.01; *, P < 0.05; NS, not statistically significant, as determined by Student's t test. (C) Graphic representation of the mean values and SDs from B.

