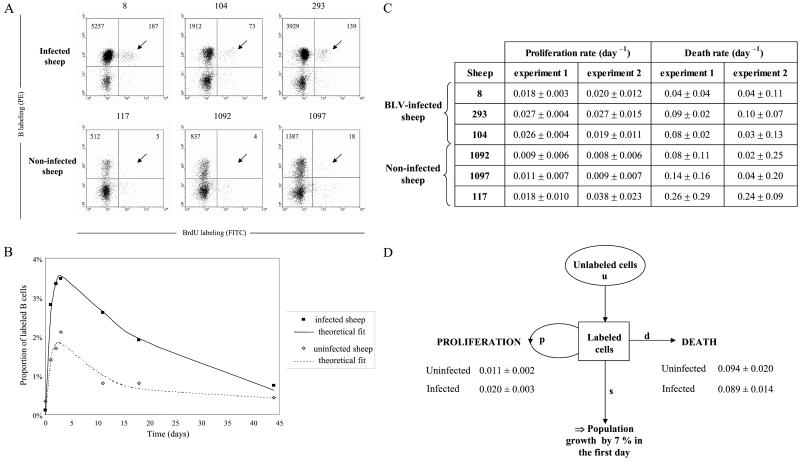
Figure 2.
BrdUrd incorporation into B lymphocytes in vivo. (A) Three BLV-infected sheep (nos. 8, 104, and 293) and three controls (nos. 117, 1092, and 1097) were injected intravenously with 500 mg BrdUrd, and an aliquot of blood (1 ml) was collected 3 days later. After lysis of the red blood cells, B cells were labeled with biotinylated 1H4 monoclonal antibody and streptavidin-PE conjugate. Then, the cells were stained with anti-BrdUrd FITC antibody in the presence of DNase and analyzed by two-color flow cytometry (x axis, BrdUrd; y axis, B lymphocytes). Ten thousand cells (lymphocytes, monocytes, and granulocytes) were acquired, and PBMCs were selected by the FSC/SSC gating. The total numbers of B cells are indicated in the upper quadrants. (B) Kinetic analysis of BrdUrd+ B cells. Blood samples from six sheep (see A) were collected at different days after BrdUrd injection. The ratio (in %) of BrdUrd+ cells within the total B lymphocyte population was determined, and the data corresponding to the measured incorporation rates were fitted to a mathematical model, yielding a theoretical fit (see Materials and Methods). Figure shows the average data for the three infected and the three control sheep. (C) Minimal proliferation and death rates (± SD) estimated from fitting the source model to the data deduced from two independent experiments. (D) Summary of the proliferation and death rates (± SD) and estimation of the population growth.

