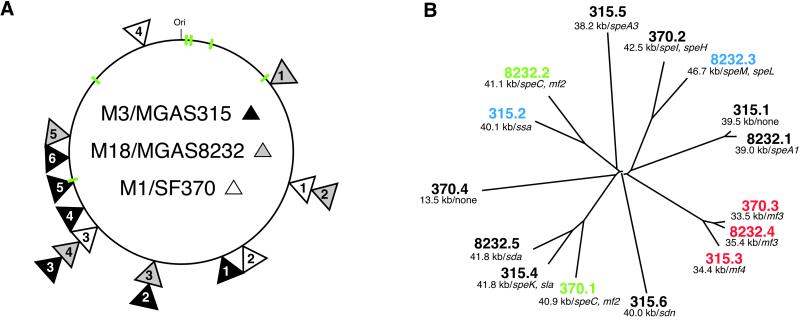
Figure 1.
GAS phages. (A) Schematic of GAS core genome and phage integration sites. Shown is the core genome (≈1.7 Mbp) derived by deleting phage sequence from the genome sequence of strains SF370 (serotype M1), MGAS8232 (serotype M18), and MGAS315 (serotype M3). Phage integration sites are indicated with triangles that are shaded to match the source GAS strain. Stacked triangles indicate that the phages are integrated at the same chromosomal site. The numbers in each triangle are designations that refer to the clockwise order of the phages. The six rRNA operons that are conserved in all three genomes are shown in green. (B) Relationships among GAS phages. Phage sequences present in the three GAS genomes were aligned with clustalw (http://inn-prot.weizmann.ac.il/software) and an unrooted tree was generated with the drawtree application in phylip (http://evolution.genetics.washington.edu/phylip.html). Phage size (kb) and proven or putative virulence factors encoded by each phage are indicated. Phages that are integrated at the same chromosomal location are color coded in B. mf2, mitogenic factor 2; mf3, mitogenic factor 3; mf4, mitogenic factor 4; sda, streptodornase alpha; sdn, streptodornase.

