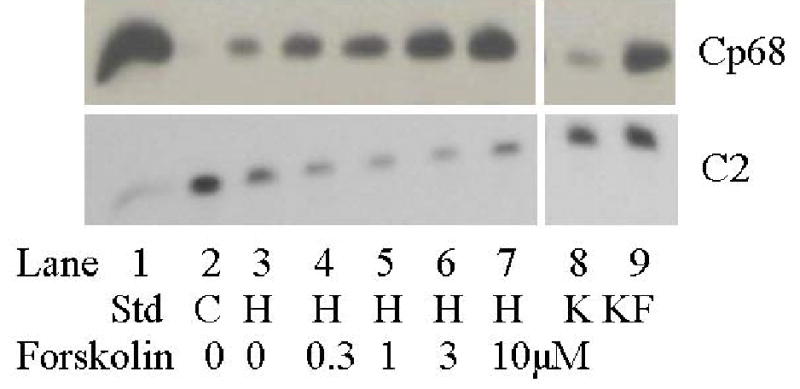
Figure 2. Changes in the CP68 (top panel) and C2 (bottom panel) PLM signals in swine carotid artery tissue homogenates.

Lane 1 (from left) is the heart sarcolemmal PLM standard that is detected by all antibodies. Lane 2 is from unstimulated swine carotid tissues, i.e the control (which is used to normalize the C2 signals in Fig. 3 as detailed in the methods). Lane 3 is from 10 μM histamine stimulated tissues. Lanes 4–7 are from tissues first stimulated with 10 μM histamine followed by addition of 0.3, 1, 3, or 10 μM forskolin to induce relaxation, respectively. Lanes 8–9 are the K and KF standards (see methods). The CP68 signal (reflecting S68 PLM phosphorylation, top panel) revealed small increases with histamine alone and larger dose dependent increases with forskolin. The C2 signal (reflecting unphosphorylated PLM, lower panel), showed decreases with histamine treatment and no further change with addition of forskolin.
