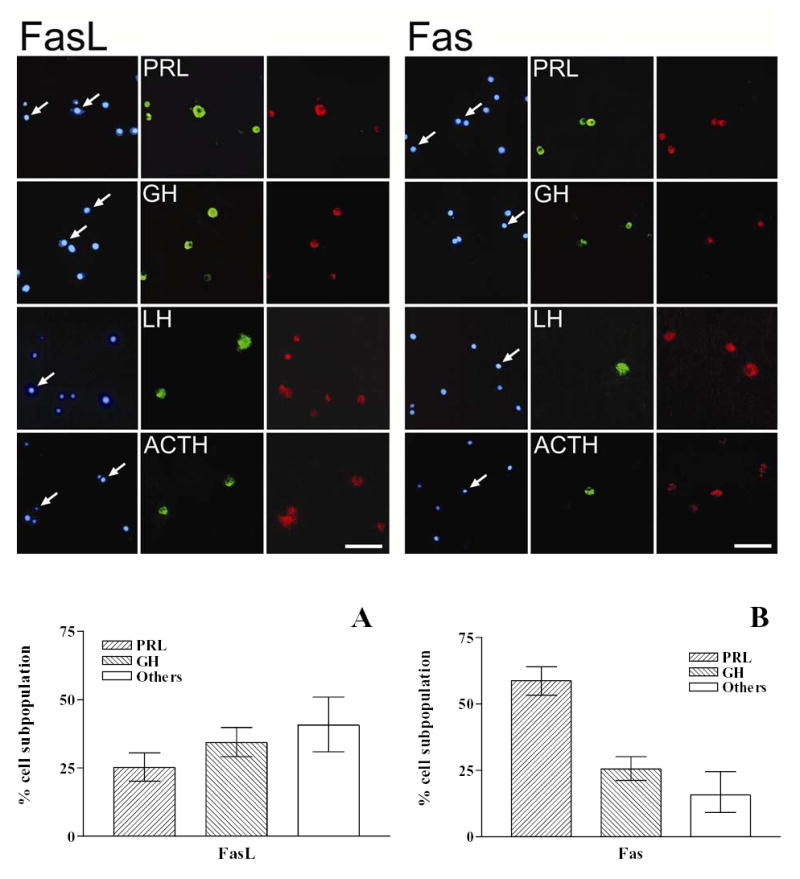
Fig. 3. Expression of FasL and Fas in different anterior pituitary cell subpopulations.

Upper panel: Cultured anterior pituitary cells from OVX rats were processed for identification of FasL or Fas and pituitary hormones by double immunofluorescence. Left panels: nuclear morphology by staining with DAPI, middle panels: immunocytochemistry for each cell subpopulation (lactotropes: PRL, somatotropes: GH, gonadotropes: LH, corticotropes: ACTH), and right panels: immunocytochemistry for FasL or Fas. Arrows indicate co-localization. Scale bar= 50 μm. Lower panel: Distribution of FasL (A) and Fas (B) immunoreactivity in different anterior pituitary cell subpopulations. Each column represents the percentage ± CL of each cell type within the immunoreactive population for FasL and Fas. (n = 300–1000 cells/group from at least 2 separate experiments).
