
Figure 1.
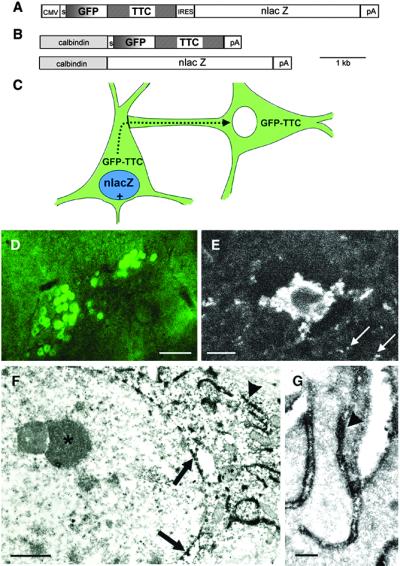
Basic description of the transsynaptic transfer system in transgenic mice. (A) Construct used for the generation of the CMV transgenic line: A CMV promoter drives expression of GFP–TTC, followed by an IRES sequence to coexpress nlacZ. (B) A calbindin promoter fragment is used to coexpress GFP–TTC and nlacZ. (C) Schematic of the transgenic strategy for mapping neuronal connections. Neurons expressing the transgenes are positive for lacZ as a nuclear marker (in blue) and fluorescent (in green) because of the expression of GFP–TTC. Neurons in synaptic contact receive the fusion protein (in green) but are β-gal negative. (D) Heavily GFP-positive neurons in the brainstem of line Cal3 detected with a 10× objective in a 70-μm slice by using FITC optics. (Scale bar, 100 μm.) (E) Strongly positive neuron, and surrounding neuropil (arrows), in the cortex of line Cal5 detected with a Zeiss two-photon microscope deep in a living slice. (Scale bar, 10 μm.) (F) Electron microscopic codetection of the GFP–TTC and β-gal proteins. Slices of a calbindin transgenic brain were stained with X-Gal, and then with an antibody to GFP followed by ABC peroxidase (16). The X-Gal staining gives small crystals in a perinuclear location (arrows), whereas the DAB stains dark in convoluted stacks of ER outside of the nucleus (arrowhead). Inside of the nucleus dense chromatin and a nucleolus are visible (asterisk). (Scale bar, 1 μm.) (G) High-power electron microscopy reveals the localization of the DAB reaction product indicative of the fusion protein at the inside of the ER lumen (arrowhead). (Scale bar, 250 nm.)