
Figure 5.
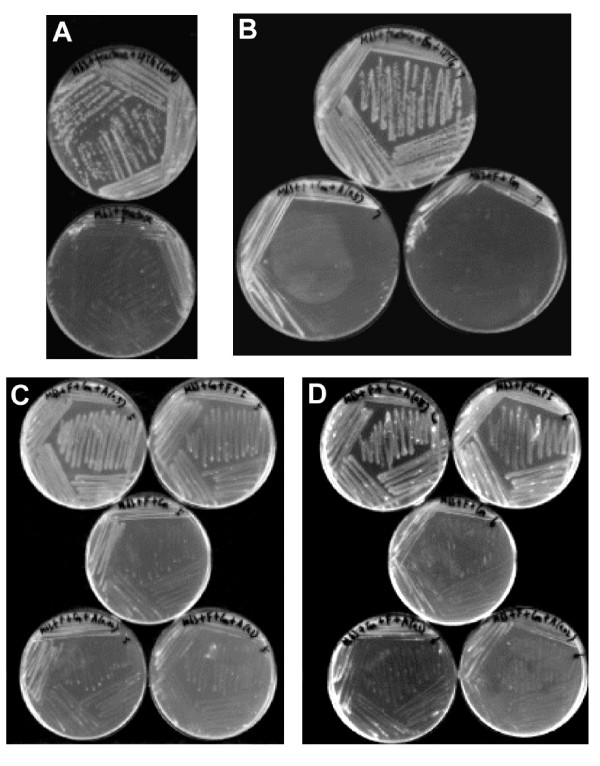
Genetic rescue experiments. The bacteria were streaked on M63 minimal solid medium and the plates were incubated at 37°C overnight. The concentration of IPTG was 1 mM. The order of the plates in each picture described below is from left to right and from top to bottom. A. EM9 host strain on M63 with IPTG; EM9 on M63 without IPTG. B. EM9 strain with pBAD vector alone (ECHP1007) on M63 with IPTG; ECHP1007 on M63 with arabinose (0.5% (W/V)); ECHP1007 on M63 without IPTG and arabinose. C. EM9 strain caring pBAD map vector (ECHP1005) on M63 with arabinose (0.5% (W/V)); ECHP1005 on M63 with IPTG; ECHP1005 on M63 without IPTG; ECHP1005 on M63 with arabinose (0.02% (W/V)); ECHP1005 on M63 with arabinose (0.1% (W/V)). D. EM9 strain caring pBAD yflG vector (ECHP1006) on M63 with arabinose (0.5% (W/V)); ECHP1006 on M63 with IPTG; ECHP1006 on M63 without IPTG; ECHP1006 on M63 with arabinose (0.1% (W/V)); ECHP1006 on M63 with arabinose (0.02% (W/V)).