Figure 1.
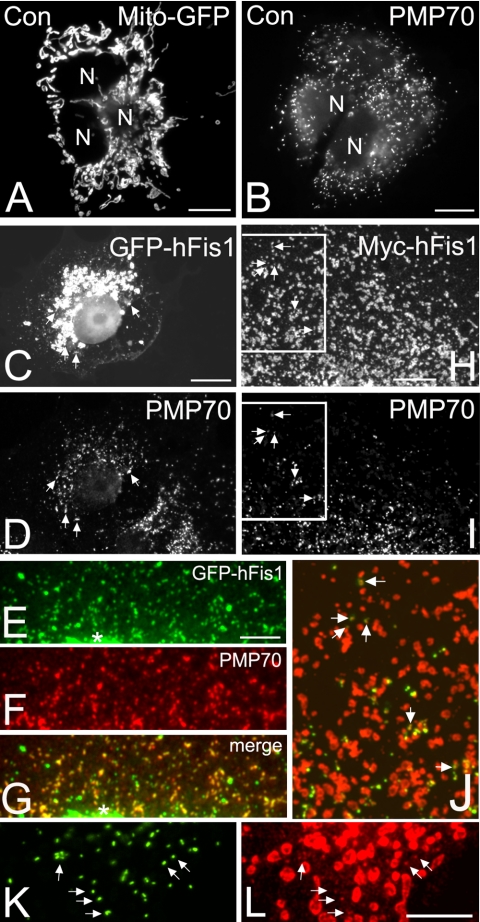
Fis1 localizes to peroxisomes and mitochondria in mammalian cells. Normal mitochondrial (A) and peroxisomal (B) morphology in COS-7 control cells processed for immunofluorescence microscopy. Mitochondria in A are visualized by expression of a Mito-GFP construct, whereas peroxisomes (B) are stained with antibodies to PMP70, a peroxisomal membrane protein. GFP-tagged (C–G) and Myc-tagged (H–J) hFis1 protein (GFP-hFis1, Myc-hFis1) colocalizes with peroxisomes. COS-7 cells were transfected with either GFP-hFis1 (C–G) or Myc-hFis1 (H–J) and processed for immunofluorescence microscopy using antibodies to PMP70 (D, F, and I) and the Myc epitope tag (H). Note that the expression of GFP-hFis1 causes aggregation of mitochondria around the nucleus (C), whereas expression of Myc-hFis1 induces their fragmentation (H). (E–G) Higher magnification view of an area close to the nucleus in a COS-7 cell transfected with GFP-hFis1. The asterisks in E and G mark the beginning of a mitochondrial aggregate. (G) Overlay (merge) of E and F. (J) Overlay and higher magnification view of boxed region in H and I. Myc-hFis1/TRITC (red), PMP70/FITC (green). (K and L) Detection of endogenous Fis1 (L) in COS-7 cells expressing a GFP-PTS1 construct (K). Arrows highlight some regions of colocalization. N, nucleus. Bars, 10 μm (A–D, H–L); 5 μm (E–G).

