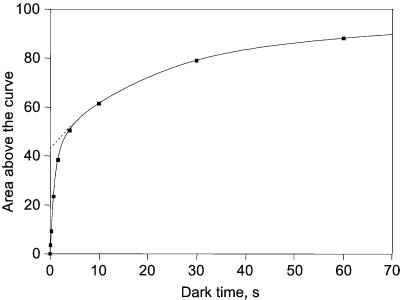
Figure 8.
Recovery of the bound area above the fluorescence induction curve (same as striped area, Fig. 7) as a function of the dark period after the 1.7-s illumination. The recovered area has been normalized to the area measured after 6 min of dark.

