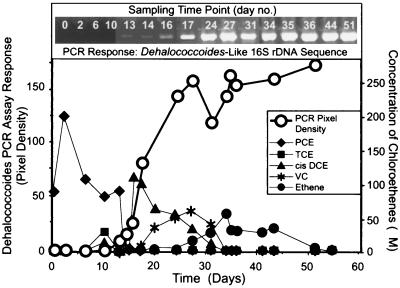
FIG. 5.
Monitoring the relationship of dechlorinating activity (PCE dechlorination product formation) to ethene and the change in the concentration of Dehalococcoides 16S rDNA in the DeLisle microcosm. The pixel densities of the PCR products as determined by the NIH Image 1.62 program were plotted against time.

