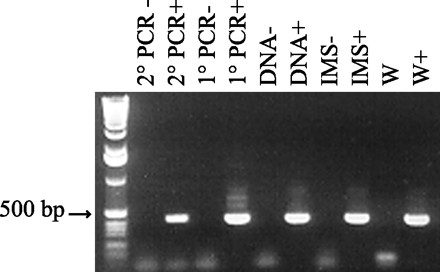
FIG. 4.

The potential for PCR inhibition was tested by seeding a surface water sample with 500 oocysts. From left to right, the lanes are as follows: molecular weight standard; negative and positive controls for secondary (2°) PCR, respectively; negative and positive controls for initial (1°) PCR, respectively; negative and positive controls for DNA extraction, respectively; negative and positive controls for IMS, respectively; surface water sample (W); seeded surface water sample (W+).
