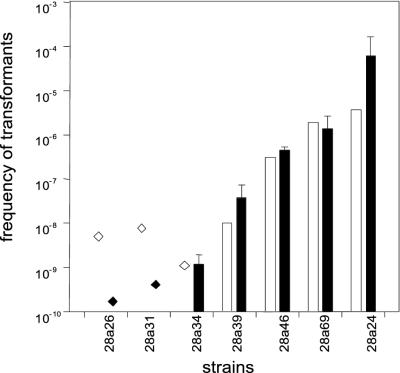
FIG. 6.
The frequency of transformation obtained by plate transformation with pUCP-Gm DNA (open symbols) of seven members of the Israel population having different transformation phenotypes. Selection was for Gmr. The data with pNS1 from Fig. 4 are included (black symbols). For transformation frequencies of strains 26a26 and 28a31, see the legend to Fig. 5.

