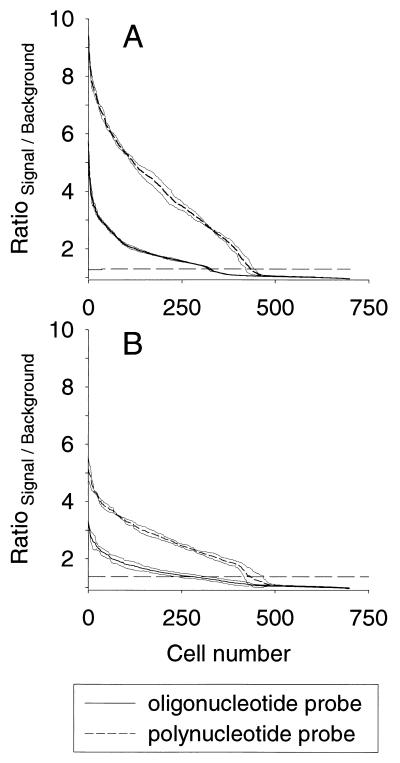
FIG. 4.
Signal-to-background ratio spectra of cells hybridized with oligonucleotide probe EUB338 (labeled with Cy3) and polynucleotide probe EUBAC (labeled with fluorescein). Samples were from Monterey Bay from 12 April 2000 (A) or 16 November 2000 (B). A signal-to-background ratio of 1 indicates object brightness equivalent to the background fluorescence, i.e., cells that were not hybridized. The horizontal broken line indicates the lower limit for positive microscopic counts with probe EUB338. Thin lines are ranges of one standard deviation of triplicate samples.

