FIG. 2.
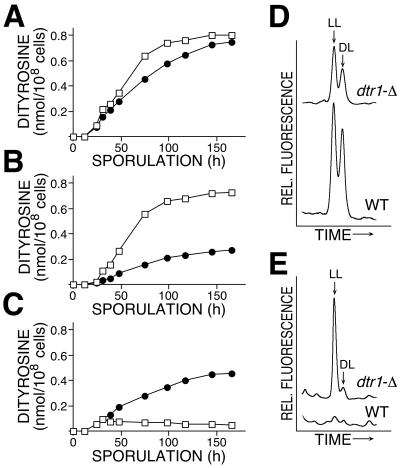
Comparison of dityrosine synthesis of dtr1-Δ and wild type. (A to C) Time course of dityrosine accumulation. Cells were removed from the sporulation cultures at the indicated times, total cells or fractions of cell homogenates were hydrolyzed in 6 N HCl, and dityrosine was quantitated by RP-HPLC. (A) Dityrosine in total cells; (B) dityrosine incorporated into spore walls; (C) soluble dityrosine in the cytoplasmic fraction. □, Wild type; •, dtr1 deletion mutant. The strain background was FY1679. (D and E) Comparison of the dityrosine content of the wall fraction (D) and the cytoplasmic fraction (E) of cells after the completion of the sporulation program. Strains used for this experiment were of the SK1 background. The relevant parts of the actual HPLC chromatograms are shown; peaks representing ll- and dl-dityrosine are indicated. The corresponding chromatograms are drawn to scale.

