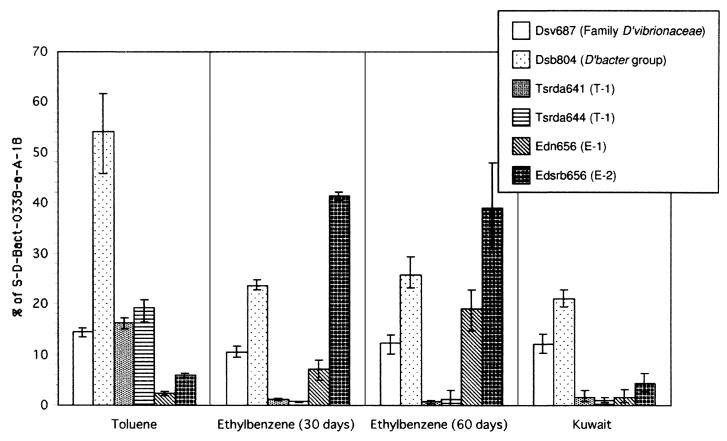
FIG. 3.
Results of quantitative membrane hybridization signals obtained with specific probes were normalized to the hybridization signal of probe S-D-Bact-0338-a-A-18. The results are expressed as a percentage of the total eubacterial 16S rRNA and represent the mean values of triplicate applications from a single sample. Vertical bars indicate maximum and minimum ratios of specific probes to eubacterial probe (S-D-Bact-0338-a-A-18) calculated by all combinations as follows: aA−1, aB−1, aC−1, bA−1, bB−1, bC−1, cA−1, cB−1, and cC−1, where the lowercase letters represent the signal intensities of each specific probe in triplicate (a, b, and c), and the capital letters represent the signal intensities of eubacterial probe in triplicate (A, B, and C). RNA samples were obtained from TDC, EDC, and oil-contaminated sediment in the coastal area of Kuwait.

