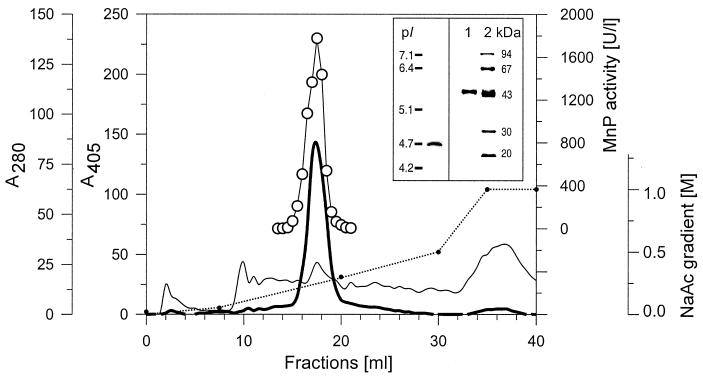
FIG. 5.
FPLC protein profile of 5-week-old concentrated culture filtrate from C. dryophila grown in the presence of Mn2+ (200 μM). The sodium acetate (NaAc) gradient is represented by a dotted line. Absorbance levels at 405 nm (bold line) and 280 nm (thin line) represent the elution of heme-containing protein and total protein, respectively, along with the MnP activity levels (open circles). Inset: IEF (left) and SDS-PAGE (right) analyses of the pooled MnP peak (lane 1) and molecular mass markers (lane 2).

