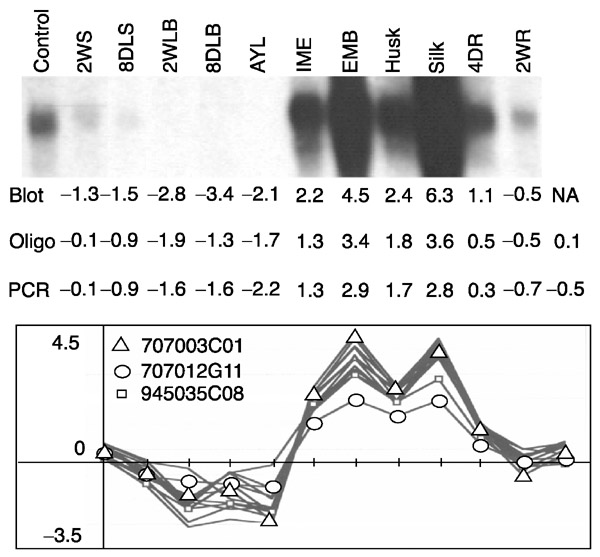
Figure 6.

Signal-ratio comparisons between RNA blot and microarray hybridizations for oligos and the corresponding PCR products. Maize RNA samples were prepared from multiple tissues and probed with a hrgp cDNA clone. The blot ratios were calculated from the signal intensity of each lane divided by the signal intensity of the control lane. Signal ratios for individual probes were calculated from microarray hybridization. All calculations are presented as log2 ratios. Tissue abbreviations as in Figure 3.
