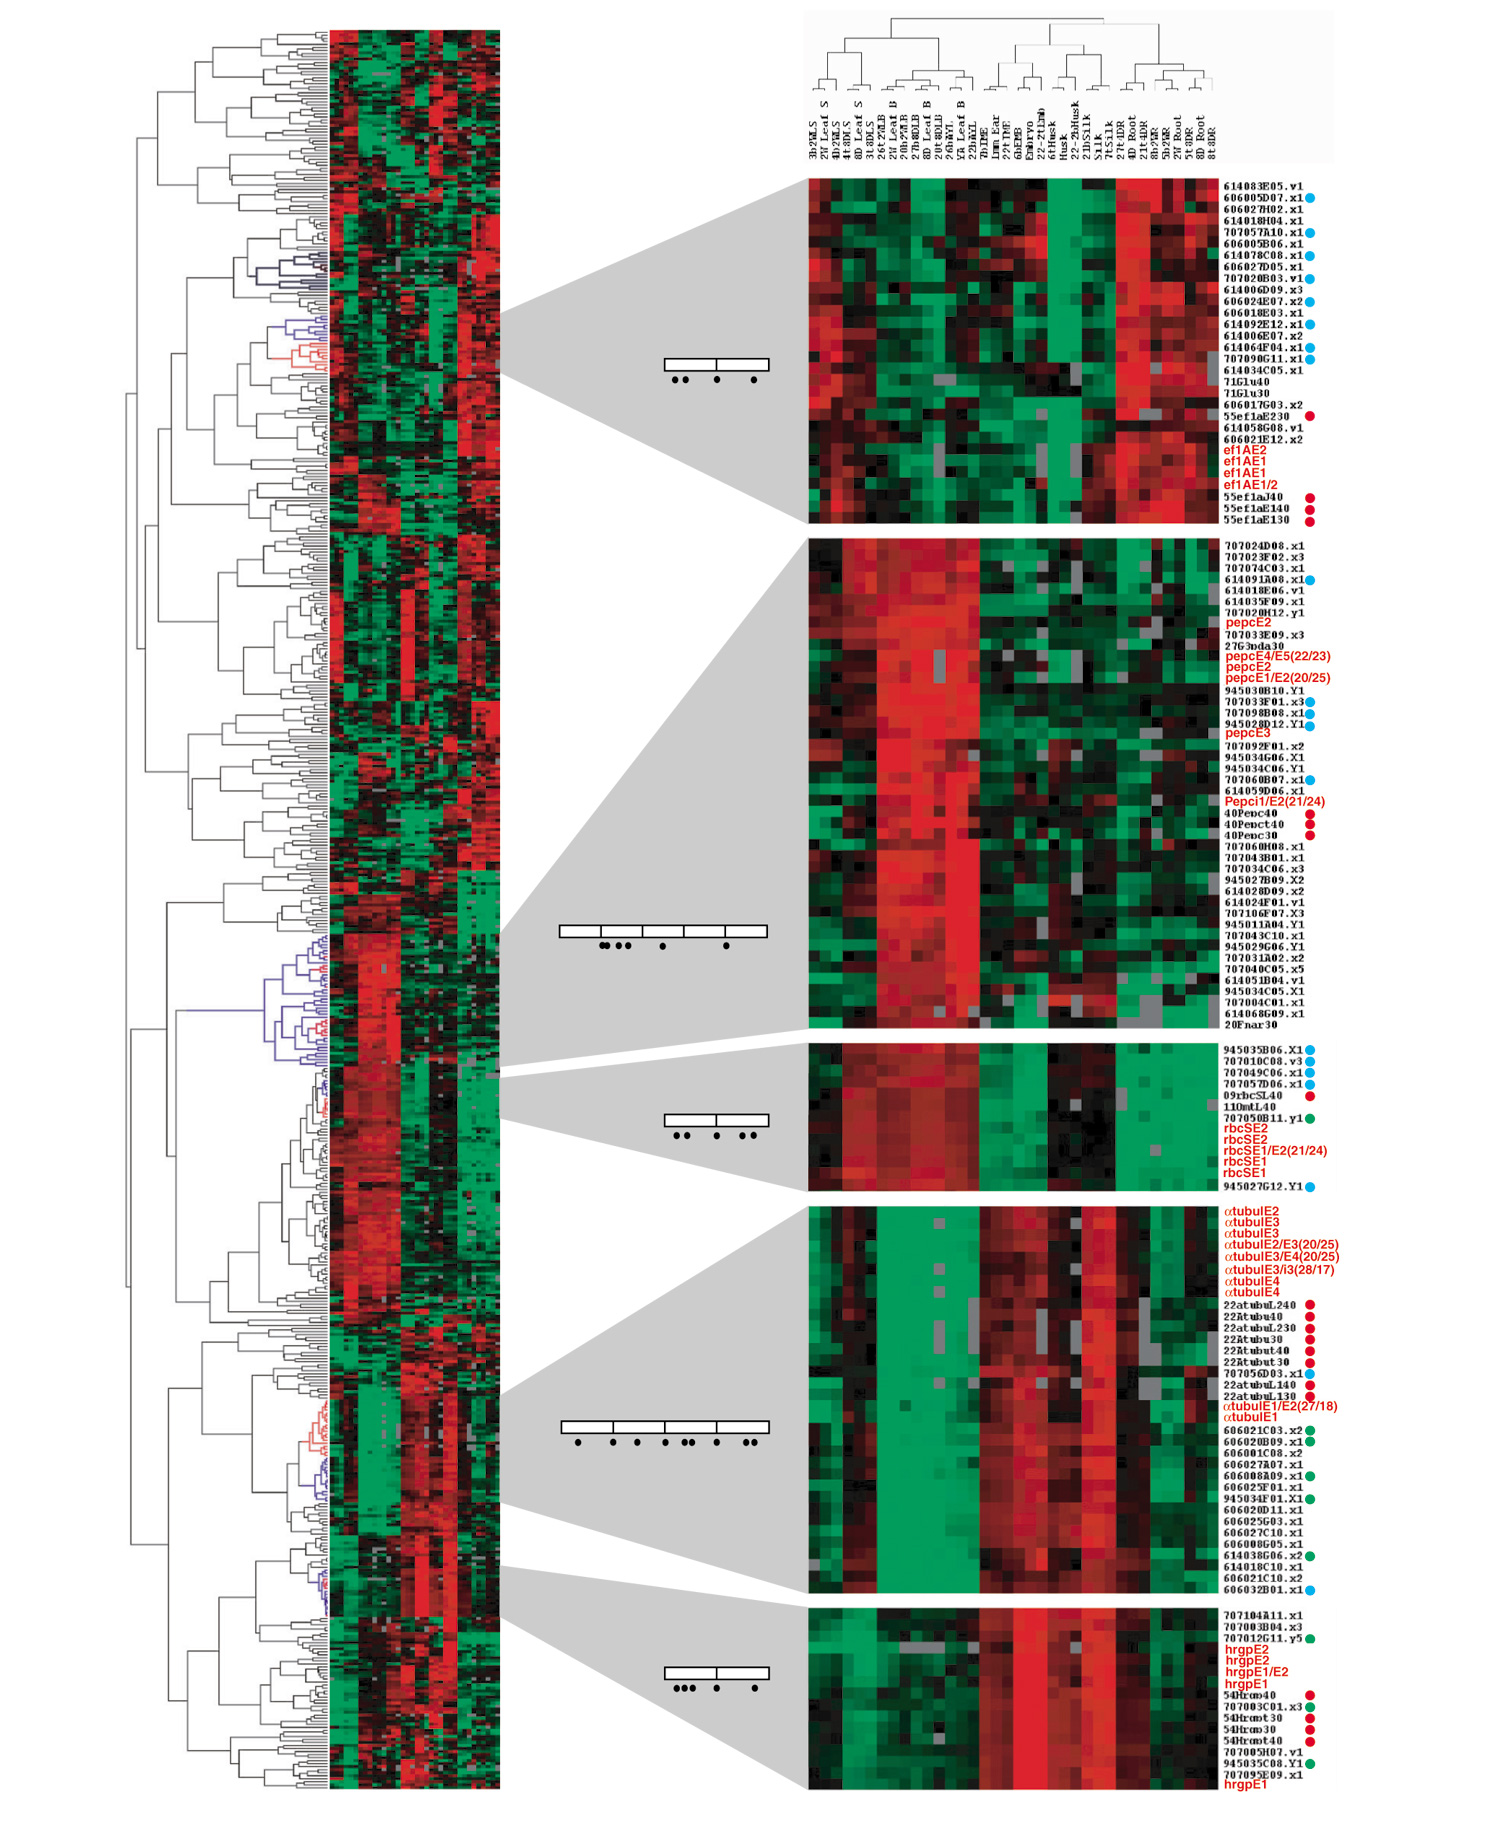
Figure 7.

Gene-expression cladogram comparing hybridization patterns of oligos and PCR probes. 582 of 5,760 probes were selected for the analyses on the basis of hybridization success rate (>80%), absolute signal ratio (|log2 ratio| > 2 in a minimum of 1 of 24 pairs of hybridizations, and mean of duplicate hybridizations) and ratio difference (max|log2 ratio| - min|log2 ratio| > 2). Red terminal branches (in the cladogram on left) mark where oligo probes are distributed in each section. Blue branches mark the common terminal branches, which include all oligo probes and one or more related PCR probes. Oligos of 45 nucleotides are in red, and 30-nucleotide and 40-nucleotide oligos are marked with red dots beside each name; the corresponding cDNA probes are marked with green dots, and functionally related genes (according to annotations) with blue dots. Most other genes with EST numbers have not yet been assigned specific functions. Open boxes within gene diagrams represent exons and bars inside each box represent splicing junctions. Black dots depict the positions of oligo probes. The color code represents the relative mRNA amounts: red is high, green is low, and black is similar to the reference sample.
