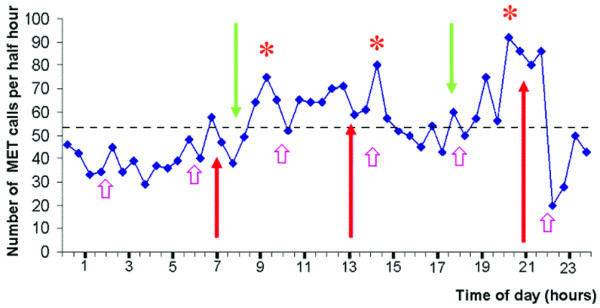
Figure 1.

Medical emergency team (MET) calls over 24 hours. Shown is a graph illustrating the number of MET calls made per half-hour over a 24-hour period for 2568 episodes of MET review in relation to aspects of daily nursing and medical routine. Arrows demonstrate periods of nursing handover (red, up-pointing arrows), the beginning and end of the daily medical shift (green, down-pointing arrows), and periods of routine nursing observations (pink, shorter, up-pointing arrows). The dotted line represents the average number of MET calls made per half-hour interval. *P < 0.05.
