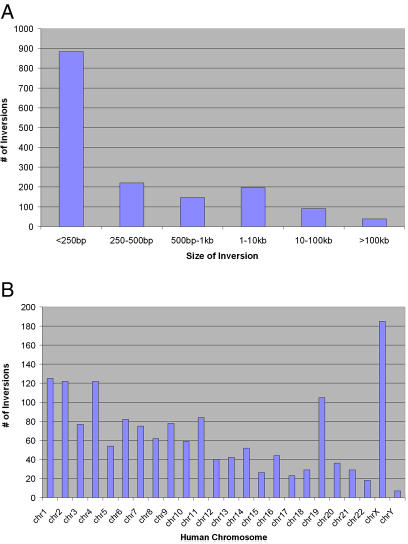
Figure 2. Size Distribution and Chromosomal Distribution of Putative Inversions.
(A) Size distribution of inversions. The size of the inversion regions identified range from 23 bp to 62 Mb, but more than half of all regions identified are less then 250 bp. The algorithm used to create the net alignments is more prone to make errors and assign random orientation to very short regions (Table S1 and Figure S1). However, we did not see this trend in the regions chosen for experimental validation. Thirty-three of the regions identified were larger than 100 kb in size.
(B) Chromosomal distribution of inversion regions. The autosomal chromosomes have a distribution of inversions roughly correlated to the size of the chromosome, except for Chromosome 19 which carries approximately the same number as Chromosomes 1 to 4. The X chromosome also shows an increase of inversions compared to autosomes of corresponding size.

