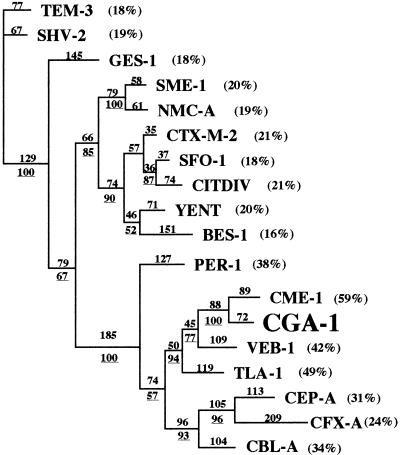
FIG. 2.
Dendrogram obtained for 18 Ambler class A ESBLs by the parsimony method (20). Branch lengths are drawn to scale and are proportional to the number of amino acid changes. The percentages at the branching points (underlined) refer to the number of times that a particular node was found in 100 bootstrap replications. The distance along the vertical axis has no significance. The percentages in parentheses are amino acid identities to CGA-1.

