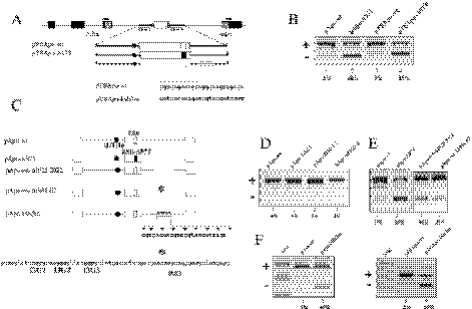
Figure 1.
An ISE sequence is located within the human apoA-II intron 3. (A) Schematic representation of the α-globin/fibronectin reporter system (pTB) used to test the effect of the mutation in the apoA-II exon 3 ESE in a heterologous system α-globin, fibronectin EDB exons and human apoA-II exon 3 are indicated in black, shaded and white boxes, respectively. The black circle indicates the (GT)16 tract. The superimposed arrows indicate the primers used in RT–PCR. The identity of the band is indicated at the left side of the gel. (B) Splicing pattern analysis of the RT–PCR products derived from cellular RNA, stained by ethidium bromide and separated on a 2% agarose gel. Comparison of the effect of the mutation A97T in the apoA-II exon 3 ESE when located in the pApo gene system and in the heterologous α-globin/fibronectin reporter system (pTB). (C) Schematic representation of the constructs carrying deletion and point mutations in the human apoA-II intron 3. White boxes, thin lines and the black circle represent the human apoA-II exons and introns and the (GT)16 tract, respectively. The ESEwt and ESEA97T are indicated as small white and black boxes within the apoA-II exon 3, respectively. Part of the human apoA-II intron 3 sequences. The G runs are in bold. The asterisk indicates a 26 bp poly-purine rich region (underlined) deletion in the apoA-II intron 3. Arrowheads indicate the different point mutations within the polypurine region in intron 3. (D) Splicing pattern analysis by ethidium bromide staining of a 2% agarose gel electrophoresis of the RT–PCR product derived from cellular RNA. The disruption of the G runs in IVS3 was carried out as followed: in the construct pApo-ΔI3G3 ggggctg→gcttatg, in pApo-ΔI3G1–2 gggcaagggg→tcacaagcgc, and in pApo-ΔI3G1–3 gggcaaggggttcagggg→tgtcaagcattcatgcg. (E) Splicing pattern analysis of Hep3B transfected cells with constructs in which partial deletion of the intron 3 were carried out. (D) Schematic representation of the human apoA-II exon 3 and its flanking introns cloned in the α-globin/fibronectin reporter system (pTB). α-globin, fibronectin EDB exons and human apoA-II exon 3 are indicated in black, shaded and white boxes, respectively. The black circle indicates the (GT)16 tract. The small white box within the exon 3 and the white rectangle in the intron 3 represents the ESE and the ISE, respectively. Arrowheads indicate the different point mutations within the polypurine region in intron 3. (F) Comparison of the splicing profiles produced by the mutations in the ISE both in the pApo gene system context and in the pTB reporter minigene. Relative amounts of exon 3 skipping are indicated below the lane numbers. The variability among three different experiments was always <20%.

